
On-Site Diesel Fuel Polishing Services in Ontario and Quebec
On-Site Diesel Fuel Polishing Services in Ontario and Quebec
On-Site Diesel Fuel Polishing Services in Ontario and Quebec
Understanding Clean / Green Fuel
Emissions and Tier Engines
The diesel engine has been a vital workhorse for many industries around the world, powering large trucks, farm equipment, railroad equipment, marine vessels, construction, and mining fleets. Diesel engine exhaust will contain harmful pollutants in a complex mixture of emission gases and particulates, which are known to be harmful to the environment and humans. These emissions include:
Oxides of Nitrogen (NOx)
Gases that forms when diesel fuel is burned with excess air.
Diesel Particulate matter (DPM)
Microscopic solid particles and liquids that form during the combustion process.
Hydrocarbons (HC)
Gaseous compounds that result from unburned fuel and lubricating oil.
Carbon Monoxide (CO)
Colorless, odorless gas produced when hydrocarbons in diesel fuel is not burned completely.
Contrary to popular public belief, diesel engines only emit a small amount of hydrocarbon (HC) and Carbon monoxide (CO), so engine manufacturers primarily focus on reducing NOx and DPM. These two types of emissions are inversely related; meaning a reduction in one generally causes an increase in the other. Such a relationship complicates the management of them.
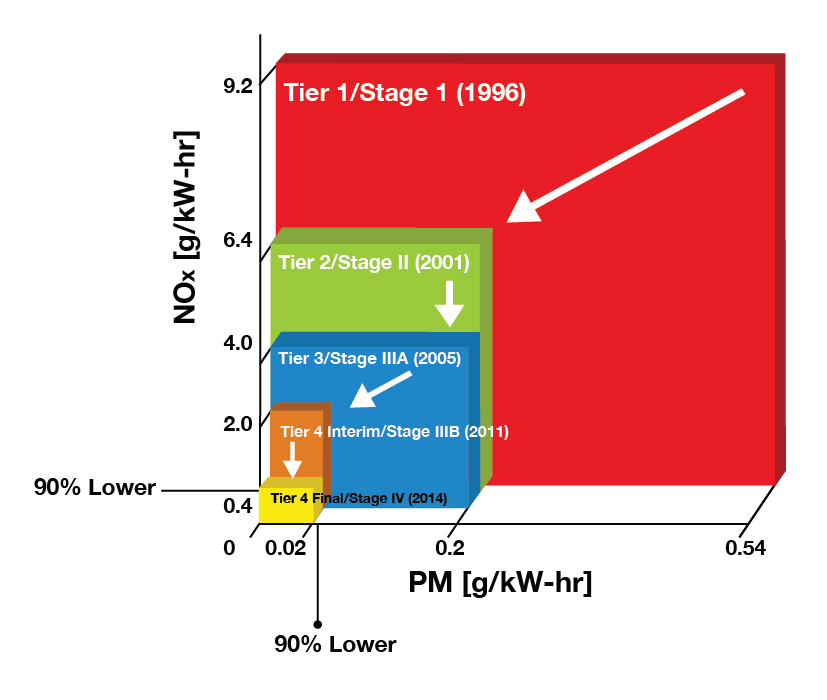
The movement towards reducing diesel emissions began in the 1970s & 80s with the USA EPA investigating engine gaseous emissions from the heavy-duty highway diesel engines. The regulation of harmful exhaust emissions began in 2000 when the levels of NOx and DPM were controlled under a “tiered” series of emissions regulations which mandated a maximum level. A huge step forward was taken in 2000 when standards issued by the US EPA fought about very large reductions in exhaust emissions for model year 2007 heavy-duty engines. These tiered structures now govern new static and off-road engines and equipment and establish progressively lower allowable emissions of NOx and DPM.
Each progression of standard level – Tier 1, Tier 2, Tier 3 and Tier 4 engines are all lower in emissions and more advanced technologically than the previous generation. Essentially the standards require that manufacturers reduce the levels of DPM and NOx to a level that is 50-96% lower than the existing generation of diesel engines. It is important to note that Tier 4 emission requirements apply to new products only and do not apply retroactively to any existing machines or equipment. A simple diagram showing the reduction in emissions and the correlating engine tier rating is shown here:
Diesel Fuels Technical Review
Please follow the link below for Chevron’s Diesel Fuels Technical Review.
http://www.chevron.com/documents/pdf/DieselFuelTechReview.pdf
Understanding ISO code as it relates to fuel cleanliness
Fluid cleanliness is critical to establishing equipment reliability and there is a direct correlation between oil cleanliness and component life.
When a wear condition advances, the size and concentration of wear particles in the oil increases. The best method for measuring particle size and concentration is particle count testing. Results are reported in particles per milliliter or particles per 100 milliliters (depending on the lab) at a given size (microns) and ISO Cleanliness Code. The ISO Cleanliness Code was developed for measuring fluid cleanliness and is widely used for determining particle counts in lubricants. It specifies the size of particles measured and the method for coding the level of contamination.
The ISO 4406 standard utilizes a three number system to classify system cleanliness — example: 19/16/13. The first number represents the number of particles present measuring greater than 4μm. The second represents particles greater than 6μm and the third represents those greater than 14μm. Consider the particle count data shown in Table 1 below. Use the ISO range codes in Table 2 to determine the system’s ISO Cleanliness Code.
Size Particles / mL
4μ 2852
6μ 541
10μ 198
14μ 56
21μ 11
38μ 1
70μ 0
100μ 0
ISO/Range Code Min. particles /mL Max particles /mL
1 0 0.02
2 0.02 0.04
3 0.04 0.08
4 0.08 0.15
5 0.15 0.3
6 0.3 0.6
7 0.6 1.3
8 1.3 2.5
9 2.5 5
10 5 10
11 10 20
12 20 40
13 40 80
14 80 160
15 160 320
16 320 640
17 640 1,300
18 1,300 2,500
19 2,500 5,000
20 5,000 10,000
21 10,000 20,000
22 20,000 40,000
23 40,000 80,000
24 80,000 160,000
25 160,000 320,000
26 320,000 640,000
27 640,000 1,300,000
28 1,300,000 2,500,000
29 2,500,000 5,000,000
30 5,000,000 10,000,000
The ISO Cleanliness Code for the test data shown in Table 1 would be 19/16/13. Because the number of 4μm particles is between 2,500 and 5,000, the corresponding ISO code is 19. Because the number of 6μm particles is between 320 and 640, the corresponding ISO code is 16. Because the number of 14μm particles is between 40 and 80, the corresponding ISO code is 13.
Work with the OEM, your lubricant and filter suppliers and your oil analysis laboratory to determine acceptable ISO cleanliness code limits for machinery by application.
Fuel Cleanliness Vs. Engine Technology
Fuel cleanliness levels using the ISO4406:1999 method were officially documented as a global standard only as recently as 1998 with the development of the Worldwide Fuels Charter (WWFC). Since its inception, the charter has established a minimum cleanliness level for each of the diesel fuels under various available categories around the world.
WWFC Diesel Category Fuel Cleanliness Standards
Diesel Category Cleanliness Level
1 10 mg/kg
2 ISO 18/16/13
3 ISO 18/16/13
4 ISO 18/16/13
Most mainstream engine OEM’s now subscribe to these standards. Interestingly however, and somewhat troubling to note is that fuel cleanliness levels being specified by engine OEM’s and the WWFC have not changed since their inception in 1998 despite the enormous advances in fuel injection technology. This relationship is best represented in the previous table that identifies the advances in fuel injection systems and clearly highlights how OEM’s and the WWFC have not responded to more stringent standards of fuel cleanliness in accordance with advancements in technology.
Diesel Fuel Injection – Advancing Technologies & Cleanliness Levels
Injection Pressure Viscosity Clearances Cleanliness
EUI 16,000 psi 1-4 cSt 5-8μm 18/16/13
HPCR 36,000 psi 1-4 cSt 1-4μm 18/16/13
Diesel Cleanliness Levels
Company Specified ISO Cleanliness Level
World Wide Fuel Charter 18/16/13
Engine OEM’s 18/16/13
Fuel Injector OEM 12/9/6
Owners and operators of diesel engines should take note that the cleanliness levels required by the fuel injector OEM’s are 64x cleaner than what the industry is being advised as an acceptable standard for engines to be fueled with. This is a critical point when considering contamination control solutions for diesel fuel systems.
Fuel Cleanliness – Deciphering the Code
When referring to the ISO4406:1999 cleanliness code, it can sometimes be difficult to comprehend how much contamination the codes actually represent in an real world operating system. To help clarify this we can use a real world scenario that is more meaningful. The example used to demonstrate this is as follows:
Model: Cummins DQKB Diesel Generator
Engine: QSK60-G3
Duty: Continuous
Rating: 1450kW (1813kVA)
Cycle: 60Hz
Load: 100% Peek Load
Run Time: 5000 hrs/year
Fuel: 74.8 US GPH (283 L/hr)
The following table provides an indication how much contamination is being presented to the engine fuel system each year under this example.
Volume of Contamination
Fuel Cleanliness Volume of Contamination
ISO 23/21/18 26.4 lb/year
ISO 18/16/13 0.8 lb/year
ISO 12/9/60 .10 lb/year
High Pressure Common Rail Fuel Systems
By far the greatest advancement over the past 10 years in engine design has been the development of the High Pressure Common Rail (HPCR) fuel injector. These remarkable devices have been the cornerstone for advances in combustion efficiency and allow an engine to achieve the stringent new emissions levels proposed by the engine Tier ratings.
While the HPCR fuel injector is a more recent development in engine design, the concept of common rail fuel injection is not. In fact, common rail fuel injection has been around in a basic form since the early 1920’s.
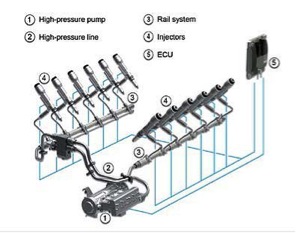
Modern HPCR fuel injection systems are practically simple in their overall design however, they comprise a number of highly complex interacting key components in order to function reliably and efficiently. The main HPCR components are listed and illustrated in the image below. Unlike older Electronic Unit Injector (EUI) designs, the HPCR fuel injector does not develop its own pressure during engine operation.
The pressure for injection is developed by the high-pressure fuel pump (1), which is mechanically operated by the engine. A common fuel rail (3) connects each injector from the fuel pump; hence where the terminology of Common Rail originated. The design of this system is such that a constant fuel pressure is available at the injector 100% of the time during engine operation thus providing a higher available mean time injection pressure over EUI designs. This feature ensures that fuel droplets are atomized the moment they leave the injector nozzle. As EUI systems must develop the fuel pressure during the injection event, they have a tendency to form larger droplets at the start and end of each injection event. HPCR injection systems are also able to regulate fuel injection pressure based on engine requirements, speed and duty using the engine ECU combined with the fuel pump.
The modern HPCR fuel injector is unlike its EUI predecessor and to understand why they are more susceptible to contamination related problems, it is important to appreciate how they function during engine operation. Unlike EUI systems, which typically inject fuel once or twice per engine revolution, HPCR fuel injectors can provide up to 5 injection events per single compression stroke of the engine.
Putting this into perspective, with a large high-speed diesel engine operating at 1400 RPM, the fuel injector is capable of injecting fuel into the combustion chamber in varying quantities depending on the ECU outputs, up to 1,750 times per minute, or 29 times per second with the fuel exiting the injector tip at speeds in excess of 700 miles per hour.
(watch thevideo below to watch the video for a lesson on how a common rail injector works and fails)
Diesel Fuel Contaminants
Contrary to popular belief, water is the most damaging contaminant found within diesel fuel and is a primary catalyst to additional fuel breakdown and the formation of other contaminants. Water can be present in diesel in dissolved, emulsified, and free states.
Water has many detrimental effects to the fuel. Dissolved water, for instance, can affect fuel stability while water in its free and emulsified states can be more problematic to the engine fuel system. Not only can water cause damage to the fuel system, including the sensitive fuel injectors, it also promotes microbial growth within a fuel tank. When enough water is present, and being that it is heavier than diesel, it will fall to the bottom of a fuel tank where additional acids can be formed causing damage to tank walls and bottoms. A layer also forms between the diesel and free water boundary and this is where microbial contaminants will grow, feeding off the hydrocarbon, but living within the water.
Dissolved Water
All diesel fuels have the ability to retain water within the fuel in a dissolved state. The ability of the fuel to hold the water in a dissolved state is highly dependent on the temperature of the fuel and its overall condition. Much like a mug of hot coffee can retain a certain volume of sugar dissolved within the water, it is the same for water in fuel. Taking the mug of hot coffee and sugar as an example, the coffee will dissolve the sugar and hold it chemically within the water while it remains hot. Sugar can continue to be added and dissolved, however, at some stage the hot coffee will be saturated with sugar and no longer be able to hold any more within solution. At this point, sugar will start to collect at the bottom of the mug, instead of dissolving into the coffee. This is what is known as the Saturation Point. Additionally, as the mug of coffee cools down over time, more and more sugar will fall out of solution and down to the bottom of the mug. This phenomenon is identical to that with water contamination in diesel fuel.
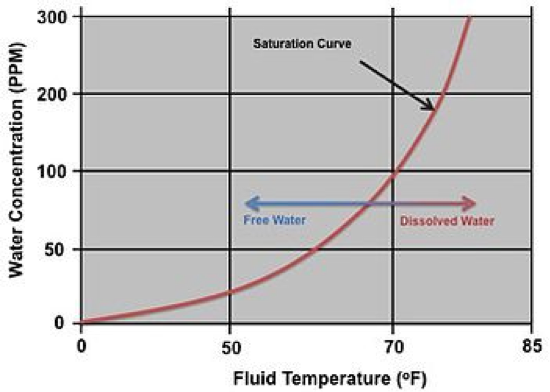
All diesel fuels have the ability to retain water in a dissolved state up to a certain volume. With most #2 diesel fuels found around the world, it is typically around 140-240ppm (0.014 – 0.024% by volume). In fact, many of the worlds diesel engine OEM’s clearly specify that water contamination must remain below 200ppm to ensure the reliable operation of the fuel injection system. Figure 4 illustrates a typical saturation curve for a diesel fuel. As can be seen, the ability for the fuel to retain water in a dissolved state is highly dependent on temperature.
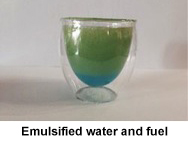
Emulsified Water
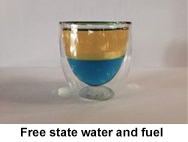
This is state whereby microscopic water droplets have fallen out of a dissolved state and due to the turbulence and the mixing effects within an operating diesel system, the water becomes emulsified and is unable to fall away and to the bottom of the tank. Figures 5 & 6 show diesel fuel with water contamination in both a Free and Emulsified state. Note that the water contamination within the examples has been died blue to provide a more clear representation of the 2 states.
Free Water
Free water is water that falls out of suspension in the fuel and gathers at the bottom of the fuel tank, as seen below. This can only occur once the diesel fuel has been saturated with water in a dissolved state and the temperature conditions are not high enough to hold additional water.
Sludge
Finding contaminants within a fuel system, that can only be described as sludge, is an indicator of a far greater problem. Sludge is typically a combination of different particulate, including microbial growth, organic and inorganic waste compounds, waxes, and other contaminants. Fuel contamination problems must be investigated for the actual cause rather than simply treating the symptom.
Asphaltenes
Asphaltenes are a bituminous material found in most diesel fuels with the concentration varying between batches and geographic location around the world. They are a natural contaminant from the refining process of producing various fuels out of a base crude oil. Asphaltenes are not soluble in fuel and are generally less than 2μm in size in their natural state, however, within diesel fuel they have a tendency to agglomerate forming clusters in the order of 100-200μm, making them a key component to premature fuel filter blockage. Asphaltenes are NOT always filtered out by fuel producers in the refining process due to their small size and the expense of removal.
In some countries in Continental Africa and South America, emissions standards are less stringent and fuel sulfur levels are higher. In these locations, diesel sulfur levels remain at 500-5000ppm and there is some evidence to suggest that such fuels are manufactured with blends of light cycle oils from the refining process in order to use more from each barrel of crude oil. Fuels in these locations are generally black in color and contain large quantities of Asphaltenes which makes the purification extremely challenging, and in many cases, very expensive.
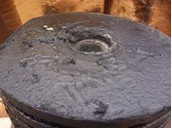
It is a fact that most filter elements in use for diesel fuel applications are changed often due to the effects of asphaltenes. Filter elements that are coated by a black tar-like substance have typically been affected by asphaltene contamination as seen below.

Wax
All diesel fuels contain wax, however, and are not generally classified as a contaminant, but will contribute to premature filter blockage if certain conditions are met. Like all waxes, the waxes found in diesel fuel will begin to crystallize if the temperature of the fuel reaches a certain point known as the “Cloud Point”. In modern diesel fuels this problem is rare, although in some ultra low sulfur biodiesel blends, the wax solubility is lower, promoting wax formation more readily. Once waxes reach the injector, the waxes will melt.
Particulate
Solid particles, such as dirt and dust, can be present within diesel fuel and cause damage to fuel system components through direct body abrasive wear and erosion. As such, particulate within the fuel is one of the main reasons for filtration and optimization system utilization.
Particulate contamination can be introduced into fuel via many means. However, it is the movement or transportation of fuel between locations where particulate contamination occurs most. Surveys conducted by industry leaders in diesel fuel contamination control have shown that each time diesel fuel is transferred between one storage location to another, the ISO4406:1999 cleanliness level will typically rise by one code. This rise in code typically means a doubling of contamination levels.

Understanding Clean / Green Fuel
Emissions and Tier Engines
The diesel engine has been a vital workhorse for many industries around the world, powering large trucks, farm equipment, railroad equipment, marine vessels, construction, and mining fleets. Diesel engine exhaust will contain harmful pollutants in a complex mixture of emission gases and particulates, which are known to be harmful to the environment and humans. These emissions include:
Oxides of Nitrogen (NOx)
Gases that forms when diesel fuel is burned with excess air.
Diesel Particulate matter (DPM)
Microscopic solid particles and liquids that form during the combustion process.
Hydrocarbons (HC)
Gaseous compounds that result from unburned fuel and lubricating oil.
Carbon Monoxide (CO)
Colorless, odorless gas produced when hydrocarbons in diesel fuel is not burned completely.
Contrary to popular public belief, diesel engines only emit a small amount of hydrocarbon (HC) and Carbon monoxide (CO), so engine manufacturers primarily focus on reducing NOx and DPM. These two types of emissions are inversely related; meaning a reduction in one generally causes an increase in the other. Such a relationship complicates the management of them.
The movement towards reducing diesel emissions began in the 1970s & 80s with the USA EPA investigating engine gaseous emissions from the heavy-duty highway diesel engines. The regulation of harmful exhaust emissions began in 2000 when the levels of NOx and DPM were controlled under a “tiered” series of emissions regulations which mandated a maximum level. A huge step forward was taken in 2000 when standards issued by the US EPA fought about very large reductions in exhaust emissions for model year 2007 heavy-duty engines. These tiered structures now govern new static and off-road engines and equipment and establish progressively lower allowable emissions of NOx and DPM.
Each progression of standard level – Tier 1, Tier 2, Tier 3 and Tier 4 engines are all lower in emissions and more advanced technologically than the previous generation. Essentially the standards require that manufacturers reduce the levels of DPM and NOx to a level that is 50-96% lower than the existing generation of diesel engines. It is important to note that Tier 4 emission requirements apply to new products only and do not apply retroactively to any existing machines or equipment. A simple diagram showing the reduction in emissions and the correlating engine tier rating is shown here:
Diesel Fuels Technical Review
Please follow the link below for Chevron’s Diesel Fuels Technical Review.
http://www.chevron.com/documents/pdf/DieselFuelTechReview.pdf
Understanding ISO code as it relates to fuel cleanliness
Fluid cleanliness is critical to establishing equipment reliability and there is a direct correlation between oil cleanliness and component life.
When a wear condition advances, the size and concentration of wear particles in the oil increases. The best method for measuring particle size and concentration is particle count testing. Results are reported in particles per milliliter or particles per 100 milliliters (depending on the lab) at a given size (microns) and ISO Cleanliness Code. The ISO Cleanliness Code was developed for measuring fluid cleanliness and is widely used for determining particle counts in lubricants. It specifies the size of particles measured and the method for coding the level of contamination.
The ISO 4406 standard utilizes a three number system to classify system cleanliness — example: 19/16/13. The first number represents the number of particles present measuring greater than 4μm. The second represents particles greater than 6μm and the third represents those greater than 14μm. Consider the particle count data shown in Table 1 below. Use the ISO range codes in Table 2 to determine the system’s ISO Cleanliness Code.
Size Particles / mL
4μ 2852
6μ 541
10μ 198
14μ 56
21μ 11
38μ 1
70μ 0
100μ 0
ISO/Range Code Min. particles /mL Max particles /mL
1 0 0.02
2 0.02 0.04
3 0.04 0.08
4 0.08 0.15
5 0.15 0.3
6 0.3 0.6
7 0.6 1.3
8 1.3 2.5
9 2.5 5
10 5 10
11 10 20
12 20 40
13 40 80
14 80 160
15 160 320
16 320 640
17 640 1,300
18 1,300 2,500
19 2,500 5,000
20 5,000 10,000
21 10,000 20,000
22 20,000 40,000
23 40,000 80,000
24 80,000 160,000
25 160,000 320,000
26 320,000 640,000
27 640,000 1,300,000
28 1,300,000 2,500,000
29 2,500,000 5,000,000
30 5,000,000 10,000,000
The ISO Cleanliness Code for the test data shown in Table 1 would be 19/16/13. Because the number of 4μm particles is between 2,500 and 5,000, the corresponding ISO code is 19. Because the number of 6μm particles is between 320 and 640, the corresponding ISO code is 16. Because the number of 14μm particles is between 40 and 80, the corresponding ISO code is 13.
Work with the OEM, your lubricant and filter suppliers and your oil analysis laboratory to determine acceptable ISO cleanliness code limits for machinery by application.
Fuel Cleanliness Vs. Engine Technology
Fuel cleanliness levels using the ISO4406:1999 method were officially documented as a global standard only as recently as 1998 with the development of the Worldwide Fuels Charter (WWFC). Since its inception, the charter has established a minimum cleanliness level for each of the diesel fuels under various available categories around the world.
WWFC Diesel Category Fuel Cleanliness Standards
Diesel Category Cleanliness Level
1 10 mg/kg
2 ISO 18/16/13
3 ISO 18/16/13
4 ISO 18/16/13
Most mainstream engine OEM’s now subscribe to these standards. Interestingly however, and somewhat troubling to note is that fuel cleanliness levels being specified by engine OEM’s and the WWFC have not changed since their inception in 1998 despite the enormous advances in fuel injection technology. This relationship is best represented in the previous table that identifies the advances in fuel injection systems and clearly highlights how OEM’s and the WWFC have not responded to more stringent standards of fuel cleanliness in accordance with advancements in technology.
Diesel Fuel Injection – Advancing Technologies & Cleanliness Levels
Injection Pressure Viscosity Clearances Cleanliness
EUI 16,000 psi 1-4 cSt 5-8μm 18/16/13
HPCR 36,000 psi 1-4 cSt 1-4μm 18/16/13
Diesel Cleanliness Levels
Company Specified ISO Cleanliness Level
World Wide Fuel Charter 18/16/13
Engine OEM’s 18/16/13
Fuel Injector OEM 12/9/6
Owners and operators of diesel engines should take note that the cleanliness levels required by the fuel injector OEM’s are 64x cleaner than what the industry is being advised as an acceptable standard for engines to be fueled with. This is a critical point when considering contamination control solutions for diesel fuel systems.
Fuel Cleanliness – Deciphering the Code
When referring to the ISO4406:1999 cleanliness code, it can sometimes be difficult to comprehend how much contamination the codes actually represent in an real world operating system. To help clarify this we can use a real world scenario that is more meaningful. The example used to demonstrate this is as follows:
Model: Cummins DQKB Diesel Generator
Engine: QSK60-G3
Duty: Continuous
Rating: 1450kW (1813kVA)
Cycle: 60Hz
Load: 100% Peek Load
Run Time: 5000 hrs/year
Fuel: 74.8 US GPH (283 L/hr)
The following table provides an indication how much contamination is being presented to the engine fuel system each year under this example.
Volume of Contamination
Fuel Cleanliness Volume of Contamination
ISO 23/21/18 26.4 lb/year
ISO 18/16/13 0.8 lb/year
ISO 12/9/60 .10 lb/year
High Pressure Common Rail Fuel Systems
By far the greatest advancement over the past 10 years in engine design has been the development of the High Pressure Common Rail (HPCR) fuel injector. These remarkable devices have been the cornerstone for advances in combustion efficiency and allow an engine to achieve the stringent new emissions levels proposed by the engine Tier ratings.
While the HPCR fuel injector is a more recent development in engine design, the concept of common rail fuel injection is not. In fact, common rail fuel injection has been around in a basic form since the early 1920’s.
Modern HPCR fuel injection systems are practically simple in their overall design however, they comprise a number of highly complex interacting key components in order to function reliably and efficiently. The main HPCR components are listed and illustrated in the image below. Unlike older Electronic Unit Injector (EUI) designs, the HPCR fuel injector does not develop its own pressure during engine operation.
The pressure for injection is developed by the high-pressure fuel pump (1), which is mechanically operated by the engine. A common fuel rail (3) connects each injector from the fuel pump; hence where the terminology of Common Rail originated. The design of this system is such that a constant fuel pressure is available at the injector 100% of the time during engine operation thus providing a higher available mean time injection pressure over EUI designs. This feature ensures that fuel droplets are atomized the moment they leave the injector nozzle. As EUI systems must develop the fuel pressure during the injection event, they have a tendency to form larger droplets at the start and end of each injection event. HPCR injection systems are also able to regulate fuel injection pressure based on engine requirements, speed and duty using the engine ECU combined with the fuel pump.
The modern HPCR fuel injector is unlike its EUI predecessor and to understand why they are more susceptible to contamination related problems, it is important to appreciate how they function during engine operation. Unlike EUI systems, which typically inject fuel once or twice per engine revolution, HPCR fuel injectors can provide up to 5 injection events per single compression stroke of the engine.
Putting this into perspective, with a large high-speed diesel engine operating at 1400 RPM, the fuel injector is capable of injecting fuel into the combustion chamber in varying quantities depending on the ECU outputs, up to 1,750 times per minute, or 29 times per second with the fuel exiting the injector tip at speeds in excess of 700 miles per hour.
(watch thevideo below to watch the video for a lesson on how a common rail injector works and fails)
Diesel Fuel Contaminants
Contrary to popular belief, water is the most damaging contaminant found within diesel fuel and is a primary catalyst to additional fuel breakdown and the formation of other contaminants. Water can be present in diesel in dissolved, emulsified, and free states.
Water has many detrimental effects to the fuel. Dissolved water, for instance, can affect fuel stability while water in its free and emulsified states can be more problematic to the engine fuel system. Not only can water cause damage to the fuel system, including the sensitive fuel injectors, it also promotes microbial growth within a fuel tank. When enough water is present, and being that it is heavier than diesel, it will fall to the bottom of a fuel tank where additional acids can be formed causing damage to tank walls and bottoms. A layer also forms between the diesel and free water boundary and this is where microbial contaminants will grow, feeding off the hydrocarbon, but living within the water.
Dissolved Water
All diesel fuels have the ability to retain water within the fuel in a dissolved state. The ability of the fuel to hold the water in a dissolved state is highly dependent on the temperature of the fuel and its overall condition. Much like a mug of hot coffee can retain a certain volume of sugar dissolved within the water, it is the same for water in fuel. Taking the mug of hot coffee and sugar as an example, the coffee will dissolve the sugar and hold it chemically within the water while it remains hot. Sugar can continue to be added and dissolved, however, at some stage the hot coffee will be saturated with sugar and no longer be able to hold any more within solution. At this point, sugar will start to collect at the bottom of the mug, instead of dissolving into the coffee. This is what is known as the Saturation Point. Additionally, as the mug of coffee cools down over time, more and more sugar will fall out of solution and down to the bottom of the mug. This phenomenon is identical to that with water contamination in diesel fuel.
All diesel fuels have the ability to retain water in a dissolved state up to a certain volume. With most #2 diesel fuels found around the world, it is typically around 140-240ppm (0.014 – 0.024% by volume). In fact, many of the worlds diesel engine OEM’s clearly specify that water contamination must remain below 200ppm to ensure the reliable operation of the fuel injection system. Figure 4 illustrates a typical saturation curve for a diesel fuel. As can be seen, the ability for the fuel to retain water in a dissolved state is highly dependent on temperature.
Emulsified Water
This is state whereby microscopic water droplets have fallen out of a dissolved state and due to the turbulence and the mixing effects within an operating diesel system, the water becomes emulsified and is unable to fall away and to the bottom of the tank. Figures 5 & 6 show diesel fuel with water contamination in both a Free and Emulsified state. Note that the water contamination within the examples has been died blue to provide a more clear representation of the 2 states.
Free Water
Free water is water that falls out of suspension in the fuel and gathers at the bottom of the fuel tank, as seen below. This can only occur once the diesel fuel has been saturated with water in a dissolved state and the temperature conditions are not high enough to hold additional water.
Sludge
Finding contaminants within a fuel system, that can only be described as sludge, is an indicator of a far greater problem. Sludge is typically a combination of different particulate, including microbial growth, organic and inorganic waste compounds, waxes, and other contaminants. Fuel contamination problems must be investigated for the actual cause rather than simply treating the symptom.
Asphaltenes
Asphaltenes are a bituminous material found in most diesel fuels with the concentration varying between batches and geographic location around the world. They are a natural contaminant from the refining process of producing various fuels out of a base crude oil. Asphaltenes are not soluble in fuel and are generally less than 2μm in size in their natural state, however, within diesel fuel they have a tendency to agglomerate forming clusters in the order of 100-200μm, making them a key component to premature fuel filter blockage. Asphaltenes are NOT always filtered out by fuel producers in the refining process due to their small size and the expense of removal.
In some countries in Continental Africa and South America, emissions standards are less stringent and fuel sulfur levels are higher. In these locations, diesel sulfur levels remain at 500-5000ppm and there is some evidence to suggest that such fuels are manufactured with blends of light cycle oils from the refining process in order to use more from each barrel of crude oil. Fuels in these locations are generally black in color and contain large quantities of Asphaltenes which makes the purification extremely challenging, and in many cases, very expensive.
It is a fact that most filter elements in use for diesel fuel applications are changed often due to the effects of asphaltenes. Filter elements that are coated by a black tar-like substance have typically been affected by asphaltene contamination as seen below.
Wax
All diesel fuels contain wax, however, and are not generally classified as a contaminant, but will contribute to premature filter blockage if certain conditions are met. Like all waxes, the waxes found in diesel fuel will begin to crystallize if the temperature of the fuel reaches a certain point known as the “Cloud Point”. In modern diesel fuels this problem is rare, although in some ultra low sulfur biodiesel blends, the wax solubility is lower, promoting wax formation more readily. Once waxes reach the injector, the waxes will melt.
Particulate
Solid particles, such as dirt and dust, can be present within diesel fuel and cause damage to fuel system components through direct body abrasive wear and erosion. As such, particulate within the fuel is one of the main reasons for filtration and optimization system utilization.
Particulate contamination can be introduced into fuel via many means. However, it is the movement or transportation of fuel between locations where particulate contamination occurs most. Surveys conducted by industry leaders in diesel fuel contamination control have shown that each time diesel fuel is transferred between one storage location to another, the ISO4406:1999 cleanliness level will typically rise by one code. This rise in code typically means a doubling of contamination levels.
Additional Links


Additional Links
Additional Links
